Growth Scenarios Analysis
The planokc process gave Oklahoma City residents an opportunity to make choices about what kind of community they want to live in and what type of community they want to leave for their children and grandchildren. In order to facilitate these choices, an exhaustive scenario planning process was undertaken so the public and decision makers could see the future consequences of choices made today.
Three realistic future land use and transportation scenarios were created for the year 2050: Scenario A, Scenario B, and Scenario C. By 2050 Oklahoma City is projected to have gained approximately 312,000 new residents and 172,000 new jobs. While all scenarios assumed the future number of residents and jobs would be the same, each had important differences related to how future housing and employment centers would be distributed across the landscape. This is referred to as the development pattern. (A development pattern includes the location of new development, its density, building types, and mix of uses. It does not include the amount of new development.) See the facing page for a description of each scenario and how they differ from each other.
Findings
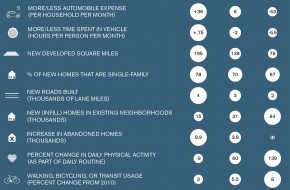
Computer modeling of the three scenarios showed how the three different development patterns affected outcomes such as commute times, air quality, the City’s fiscal health, and other important factors related to quality of life and community.
The cost analysis showed that the savings for more compact and mixed land use patterns are substantial. Given the anticipated growth by the year 2050, Scenario A would cost the city approximately $82 million more per year in operations and capital costs than the more efficient Scenario C.
Large amounts of low-density development have high costs of growth for the private-sector as well. Scenario A would require over 4,300 new road lane miles, and almost 2,000 miles of water and sewer pipes. While the City would fund a portion of these costs ($1.4 billion), private developers would cover a larger portion, totaling $5.4 billion over 40 years. This is double the private-sector capital costs of $2.6 billion forecast for Scenario C. Other major findings are summarized in the “Scenario Performance” section that follows.
Key Implications
- Continuation of recent development patterns would be costly for the City. Development patterns have the ability to significantly impact City costs. In nearly every category, we found the costs of the City’s core services and infrastructure to be more expensive in the lower-density, less integrated scenario.
- Low-density, less integrated development is also more costly for private developers. The City is not the only entity that will bear the costs of inefficient land use patterns. Private developers have a huge financial stake in how the city grows. Although the City maintains almost all the streets, sewer pipes, and water mains in the city, private developers pay to build most of these facilities themselves.
- Change is needed to avert high costs of growth. Oklahoma City has historically seen development spread out in a casual, spontaneous manner. These past development patterns have put a burden on the City budget, and if these trends continue, the costs of services and infrastructure per household will continue to rise. To avert these high costs of growth, a change is needed. The City needs to be thoughtful and strategic about where and when development happens, recognizing some areas and development patterns are more affordable to serve than others, and development timing influences cost as well.
If more efficient development patterns are pursued, the savings described could be reinvested in other important urban amenities like transit, parks, or public safety.
Scenario A: Past Trends Continued
This scenario assumes that development patterns over the past 20 years will continue. The city would continue to spread out in a somewhat casual, spontaneous way, with most new housing (75%) located in single-family-detached subdivisions on medium or large lots.
Workplaces would be located relatively far from homes, meaning commute times would be a little longer than they are now. New commercial development would most often be located at the corners of busy streets, and would not be easily accessible from nearby neighborhoods except by car. City services and infrastructure would have to be extended farther into undeveloped areas. Only a small amount of redevelopment and infill would occur in existing neighborhoods, and decline and abandonment will continue in areas currently experiencing these challenges.
Scenario B: Trends+Market+Efficiency
This scenario is influenced by past development patterns, but it assumes that new development is located near existing infrastructure and services like streets, water, police, and fire. It is also shaped by expected housing needs based on changing demographics. Single family lot sizes would be a little smaller on average so that they more closely match what residents say they want according to the 2013 Housing Demand Study.
Mixed-use nodes and corridors that integrate commercial and residential development are more prevalent, making it possible to bike, walk, or ride transit to multiple destinations. A more compact development pattern means workplaces and homes would be closer, allowing for shorter commutes. There will be some redevelopment in urban neighborhoods; however, some decline and abandonment would continue to occur.
Scenario C: Market+Efficiency+Revitalization
This scenario illustrates efficiency and high performance for residents, public services and infrastructure. It does not reflect past land development trends but instead optimizes the location and density of new development to reduce cost and negative impacts of growth. It accomplishes this while reflecting citizens’ desires for adequate housing of all types, including medium- and large-lot single-family-detached homes. This scenario still assumes that most (67%) new homes would be single-family-detached, but lot sizes would be a little smaller on average.
More new development would be concentrated into and around mixed-use nodes and corridors. Workplaces, homes, parks, and stores would be closer to each other, and streets and sidewalks would be more connected, allowing for even shorter commutes and more walkable neighborhoods. High amounts of rehabilitation and redevelopment would be expected to occur in existing neighborhoods, leading to a turnaround in currently challenged areas.
Scenario Characteristics
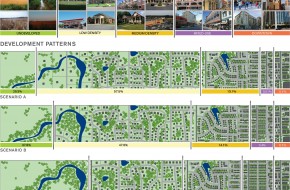
The images and charts shown here give more detail about the kinds of buildings, layout of development, and housing stock that combine to define each scenario. While the same buildings appear in each scenario, the placement and mixture differs from scenario to scenario.
Citizen Feedback
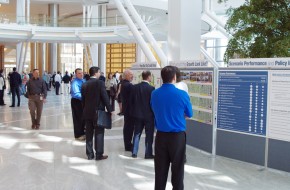
Citizens were given the opportunity to express their opinion about the scenarios through a series of workshops held in numerous locations throughout the city. In addition to the in-person workshops, many citizens took advantage of the online workshop and survey, which duplicated the in-person experience to the extent possible.
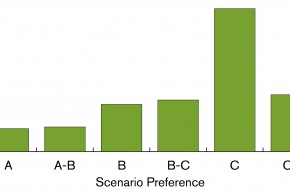
Participants took a survey which had a series of questions designed so that respondents could have an understanding of the benefits and trade-offs for each choice they were asked to make. Each question described a range of possible outcomes, how the City could arrive at each outcome, what would have to be done, and what possible trade-offs would be involved. Questions were answered by selecting option A, which corresponded to Scenario A, or option B, which corresponded to Scenario B, and so on. Respondents were also able to answer “somewhere between A and B”. The chart below summarizes the responses of all participants (both in-person and on-line). The results can be interpreted simply by saying the participants prefer to have a future city that has the characteristics of Scenario C. Respondents to the citizen survey also generally preferred policies consistent with Scenario C.
Key Findings of Growth Scenarios Workshops
- 86% of participants would live on a slightly smaller lot or in a higher density area in order to live within walking or biking distance to a park.
- 83% of participants voiced support for more housing type choices, such as small-lot single family, townhomes, condominiums.
- 90% of participants felt that growth should occur more densely or in existing neighborhoods in order to free up more money for street maintenance.
- 89% of participants supported guiding growth into existing areas in order to generate more opportunities for people to walk, bike, or take transit to a variety of destinations.
- 78% of participants preferred to increase density and mixed-use development in some areas in order to reduce the amount of time spent traveling in cars in the future.
- 67% of participants preferred to increase density and mixed-use development in some areas in order to reduce future transportation costs.
