Service Efficiency & Availability
LAND SUPPLY AND EFFICIENCY OF SERVICES
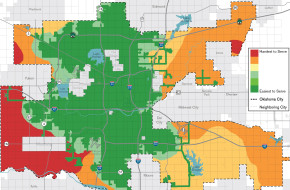
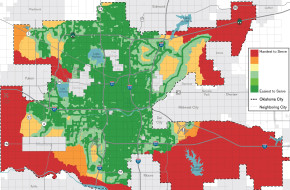
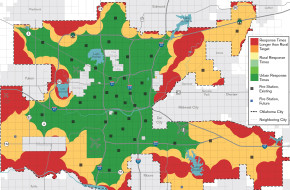
The Land Use Plan utilizes a detailed analysis of service efficiency to determine where urbanized Typology Areas should be designated. The Urban Low Intensity LUTA (UL) was applied through an analysis of three primary utilities and services – sanitary sewer, water, and fire, as illustrated in the maps at right. Urban Low Intensity is applied to areas that already have good access to these core services. Areas that do not have good access were designated as Urban Reserve (areas that may be appropriate for future urban development); RL and RM (areas that should remain at a density lower than what is efficient to provide urban services to); and Agricultural Preserve (active or potential agricultural land).
The goal of the Land Use Plan as it relates to the area designated for urbanization is two-fold: (1) direct urban development into areas that are most efficient for the City to serve; and (2) ensure that there is enough land supply within the designated area so that affordability is not compromised due to a lack of developable land. The latter goal is called “market choice”.
LAND SUPPLY IN URBANIZED AREAS
The Land Supply map to the right illustrates the total amount of developable land within typology areas designated for “urban” development. This includes total buildable acreage (excluding undevelopable land) that is served by utilities (red), total acreage that is buildable, served by utilities, and urban zoned (dark grey) and acreage that is buildable, served, zoned, and platted (black).
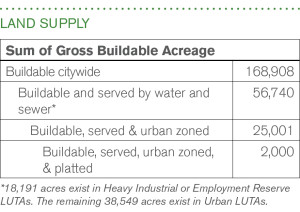
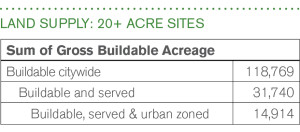
As described in the charts below, the land supply for urbanized development in the Land Use Plan consists of:
- over 56,000 acres of land for new development that is both buildable and currently served by water and sewer;
- 25,000 acres of land already zoned for development;
- 31,700 acres of buildable, served land that is currently in large 20 acre+ tracts available for sub-division;
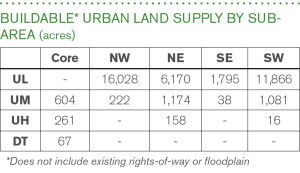
The distribution of land supply by city sub-areas is found in the third chart below.
MARKET CHOICE
The population forecast used in planokc called for approximately 39,000 new residential units to be built in Oklahoma City in both urban and rural areas over the next 10 years. 37,500 – 96% – of this growth will be built in urban areas.
Over the next 10 years, if Oklahoma City were to grow the way it has over the past two decades, market choice will be 3.75 within urban LUTAs. In other words, there will be 3.75 times more land than is needed to serve demand. planokc expects and facilitates a more compact development pattern than past trends, meaning for anticipated future demand, the land supply is 6.73 times the amount of projected growth.

SERVICE PROVISION
Each city service can be provided more effectively and with lower cost if the major factors influencing service are given a leading position in determining how that service will be provided. For efficiency it is most desirable to use any extra capacity in these systems that we have now, and then grow them in a way that generates the least new cost. For example, sewerage can be pressurized and pushed uphill or over long distances, but it requires additional facilities and large and constant expenditures of energy. A more efficient method is to use gravity flow by strategically opening new sewersheds at the appropriate time. Fire, water, and sewer services are impacted by location much more than other City services:
Fire Service: Most calls for emergency service need quick response so the travel distance to any point from a fire station becomes the controlling feature of how well fire services can be provided to that point.
Water Service: Water is delivered through pressurized pipes, so the further away from treatment plants or the higher up water must be pushed, the more energy will be used. It is also much less expensive to connect to pipes that are already in place than to extend new pipes into new areas and skip past those pipes that are in place but underutilized.
Sewer Service: The sewer system is heavily reliant on gravity flow and does everything possible to avoid costly pumping and lifting, making natural topography of greatest importance to the system. Development is most efficient where pipes already exist or are close-by and lead down to an existing treatment plant.
On the table below and the maps at right, green indicates areas that are currently served, have some available capacity, and could therefore support more development efficiently; yellow shows areas where expansion of urban services would be least costly; red shows areas that would be difficult and costly to provide with urban services. The confluence of good service for all three categories indicates readiness for urban development.
| SEWER SERVICE AVAILABILITY | WATER SERVICE AVAILABILITY | FIRE SERVICE AVAILABILITY |
|
| Fully served areas (within 1/8th of a mile of a sewer line). | Currently served. | Less than 300 seconds of travel time (target urban service level) from a station in an urban LUTA. | |
| Within 1/2 mile of a downstream main; or within sewer sheds that are efficient to serve. | Close proximity to fully looped, well-connected portions of water network | N/A | |
| Within open shed or partially open shed. Need for new capital investment to open entirely to new development. | Potential connectivity – likelihood of good pressure without substantial boosting. | Less than 390 seconds of travel time (target rural service level) from a station. | |
| Potential long-term connectivity to the system based on significant capital investment required to expand infrastructure. | Potential connectivity – need to determine if pressure will be sufficient or whether a booster station is required. | N/A | |
| Need for major investment on the scale of lift stations or a new wastewater treatment plant. | Not efficient to serve based on distance from water source and the number of areas of the city that have better connectivity and service potential. | Longer travel times than urban or rural targets. |
